When we decided to use Azure SQL Database, we trusted that, as a fully managed PaaS service, it would handle all routine maintenance and performance optimisation behind the scenes. After all, that’s one of the main selling points of a managed service — less time worrying about databases and more time building features. However, we recently encountered unexpected slowness and performance degradation, which made it clear that, even with Azure handling most management tasks, some performance issues still require our own investigation and fine-tuning.
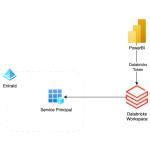
Our setup is built around Azure SQL Database as the central repository for data warehousing and data integration. The goal is to consolidate information from multiple environments into a single, accessible platform that supports analytics and reporting through Azure Data Factory (ADF) and Microsoft Fabric.
The Cause
One of the key data sources in this architecture is an Oracle database. To bring this data into Azure, we perform direct copies from Oracle to Azure SQL. The process is straightforward. For each data load, we truncate the target table in Azure SQL. We then copy the latest data from Oracle into it. This keeps the Azure SQL tables up to date with the source system. It removes the need for incremental logic or change tracking. This simple approach has worked well for us in most cases.
It’s worth noting that Microsoft does not recommend this truncate-and-reload approach for production workloads. Instead, their best practices emphasise using incremental data loads — updating only the rows that have changed since the last load. Incremental updates reduce resource consumption, improve performance, and minimise the impact on the target database, especially as data volumes grow.
How Azure SQL Index Fragmentation Impacts Performance
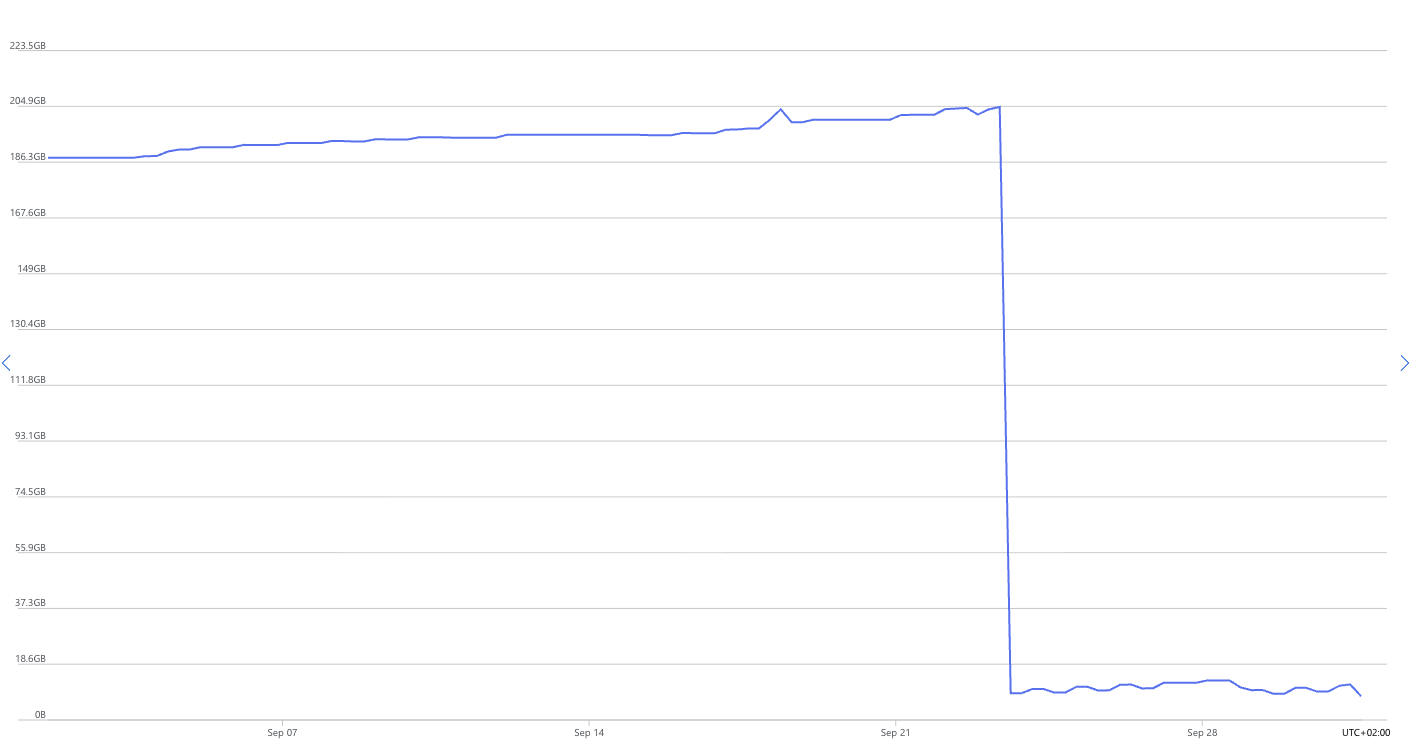
After some months of running this process, we noticed that our Power BI reports started slowing down dramatically. Even simple SQL queries that used to return results instantly were now taking more than five minutes to complete. That was our signal to start digging deeper. From the Azure Portal, we observed that the database storage size kept increasing after each data load, even though the source data volume remained almost the same, with only minor daily changes. Before long, we were running low on storage, which clearly indicated that something unusual was happening beneath the surface. Please take a look at the following picture for the data size trend, which shows this increase and the drop after the fix.
Detecting Azure SQL Index Fragmentation with Built-In Tools
As we looked deeper and analysed the queries, we discovered that the indexes on the affected tables and views had grown dramatically. This was unusual because the data volume itself hadn’t changed much. When we inspected the database metadata — including RowCounts, TotalPages, UsedPages, DataPages, TotalSpaceMB, UsedSpaceMB, and DataSpaceMB — the numbers didn’t add up. The indexes were consuming far more space than expected, suggesting that internal fragmentation or storage inefficiency was causing the issue. To better understand what was happening, we ran the following query to check the row counts, page usage, and space allocation details for the affected tables:
SELECT
SCHEMA_NAME (t.schema_id) as Shcema,
    t.NAME AS TableName,
    i.name AS IndexName,
    SUM(p.rows) AS RowCounts,
    SUM(a.total_pages) AS TotalPages,
    SUM(a.used_pages) AS UsedPages,
    SUM(a.data_pages) AS DataPages,
    (SUM(a.total_pages) * 8) / 1024 AS TotalSpaceMB,
    (SUM(a.used_pages) * 8) / 1024 AS UsedSpaceMB,
    (SUM(a.data_pages) * 8) / 1024 AS DataSpaceMB,
    ps.avg_fragmentation_in_percent AS FragmentationPercent
    FROM
    sys.tables t
INNER JOIN
    sys.indexes i ON t.OBJECT_ID = i.object_id
INNER JOIN
    sys.partitions p ON i.object_id = p.OBJECT_ID AND i.index_id = p.index_id
INNER JOIN
    sys.allocation_units a ON p.partition_id = a.container_id
INNER JOIN
    sys.dm_db_index_physical_stats(DB_ID(), NULL, NULL, NULL, 'LIMITED') ps
    ON i.object_id = ps.object_id AND i.index_id = ps.index_id
WHERE
    t.NAME NOT LIKE 'dt%' AND
    i.OBJECT_ID > 255
    --i.index_id <= 1
GROUP BY
    t.NAME, i.object_id, i.index_id, i.name, ps.avg_fragmentation_in_percent,SCHEMA_NAME (t.schema_id)
ORDER BY
    TotalSpaceMB DESC,
    OBJECT_NAME(i.object_id)
The solution
After identifying that the issue was due to index fragmentation and insufficient space being released after each TRUNCATE operation, we decided to rebuild and recalculate the indexes on the affected tables. This process effectively removed fragmented index pages and reclaimed the unused storage space that had accumulated over time. Once the indexes were refreshed, the database size dropped significantly, query performance returned to normal, and our Power BI reports started running smoothly again. In short, cleaning up the indexes resolved the slowness and storage growth issues completely.
To prevent this issue from recurring, we implemented a stored procedure that performs index cleanup at the end of each ADF pipeline run. This ensures that any fragmentation caused by the TRUNCATE-and-load process is addressed automatically, keeping the database healthy and performant. Here is the code for the stored procedure:
CREATE PROCEDURE [dbo].[Index_Maintenance]
AS
BEGIN
    -- Creates the log table if necessary
    IF NOT EXISTS (
        SELECT * FROM sys.objects
        WHERE object_id = OBJECT_ID(N'[dbo].[IndexMaintenanceLog]') AND type in (N'U')
    )
    BEGIN
        CREATE TABLE [dbo].[IndexMaintenanceLog] (
            LogID INT IDENTITY(1,1) PRIMARY KEY,
            SchemaName NVARCHAR(128),
            TableName NVARCHAR(128),
            IndexName NVARCHAR(128),
            ActionTaken NVARCHAR(20),
            Fragmentation FLOAT,
            ActionDate DATETIME DEFAULT GETDATE()
        )
    END

    DECLARE @TableName NVARCHAR(128)
    DECLARE @IndexName NVARCHAR(128)
    DECLARE @SchemaName NVARCHAR(128)
    DECLARE @SQL NVARCHAR(MAX)
    DECLARE @Frag FLOAT
    DECLARE @Action NVARCHAR(20)

    DECLARE cur CURSOR FOR
    SELECT
        s.name AS SchemaName,
        t.name AS TableName,
        i.name AS IndexName
    FROM
        sys.indexes i
        INNER JOIN sys.tables t ON i.object_id = t.object_id
        INNER JOIN sys.schemas s ON t.schema_id = s.schema_id
    WHERE
        i.type_desc IN ('CLUSTERED', 'NONCLUSTERED')
        AND i.name IS NOT NULL

    OPEN cur
    FETCH NEXT FROM cur INTO @SchemaName, @TableName, @IndexName

    WHILE @@FETCH_STATUS = 0
    BEGIN
        SELECT @Frag = avg_fragmentation_in_percent
        FROM sys.dm_db_index_physical_stats (DB_ID(), OBJECT_ID(@SchemaName + '.' + @TableName), NULL, NULL, 'LIMITED')
        WHERE index_id = (SELECT index_id FROM sys.indexes WHERE name = @IndexName AND object_id = OBJECT_ID(@SchemaName + '.' + @TableName))

        SET @SQL = NULL
        SET @Action = NULL

        IF @Frag >= 5 AND @Frag < 30
        BEGIN
            SET @SQL = 'ALTER INDEX [' + @IndexName + '] ON [' + @SchemaName + '].[' + @TableName + '] REORGANIZE;'
            SET @Action = 'REORGANIZE'
        END
        ELSE IF @Frag >= 30
        BEGIN
            SET @SQL = 'ALTER INDEX [' + @IndexName + '] ON [' + @SchemaName + '].[' + @TableName + '] REBUILD WITH (ONLINE = ON);'
            SET @Action = 'REBUILD'
        END
        IF @SQL IS NOT NULL
        BEGIN
            EXEC sp_executesql @SQL

            INSERT INTO [dbo].[IndexMaintenanceLog] (SchemaName, TableName, IndexName, ActionTaken, Fragmentation)
            VALUES (@SchemaName, @TableName, @IndexName, @Action, @Frag)
        END
        FETCH NEXT FROM cur INTO @SchemaName, @TableName, @IndexName
    END

    CLOSE cur
    DEALLOCATE cur

    RETURN 1
END
GO
The script loops through each index by using a cursor. It calculates fragmentation with sys.dm_db_index_physical_stats. It then decides whether to reorganise the index at 5–30% fragmentation. For 30% or higher, it rebuilds the index online. After the action, it logs the index name, table, schema, fragmentation level, and action taken. This keeps indexes optimised and reduces fragmentation. It also maintains a history of maintenance actions for auditing or troubleshooting.